THE REGEX KING
Jeff Sisson's blog (email me)
New York State election data quest
Somewhere in the dead zone after the 2016 election, adrift in a season of wanting to pour some energy into something hopeful, I read Mike Migurski’s two blog posts 1 2 about legislative redistricting and gerrymandering. These are worth reading in full, but the basic idea is that it should be possible to create a “court-friendly measure” for evaluating the partisan effects of the makeup of election districts at the state level, which would allow courts to determine which redistricting plans are representative and which are naked power grabs by Republicans.
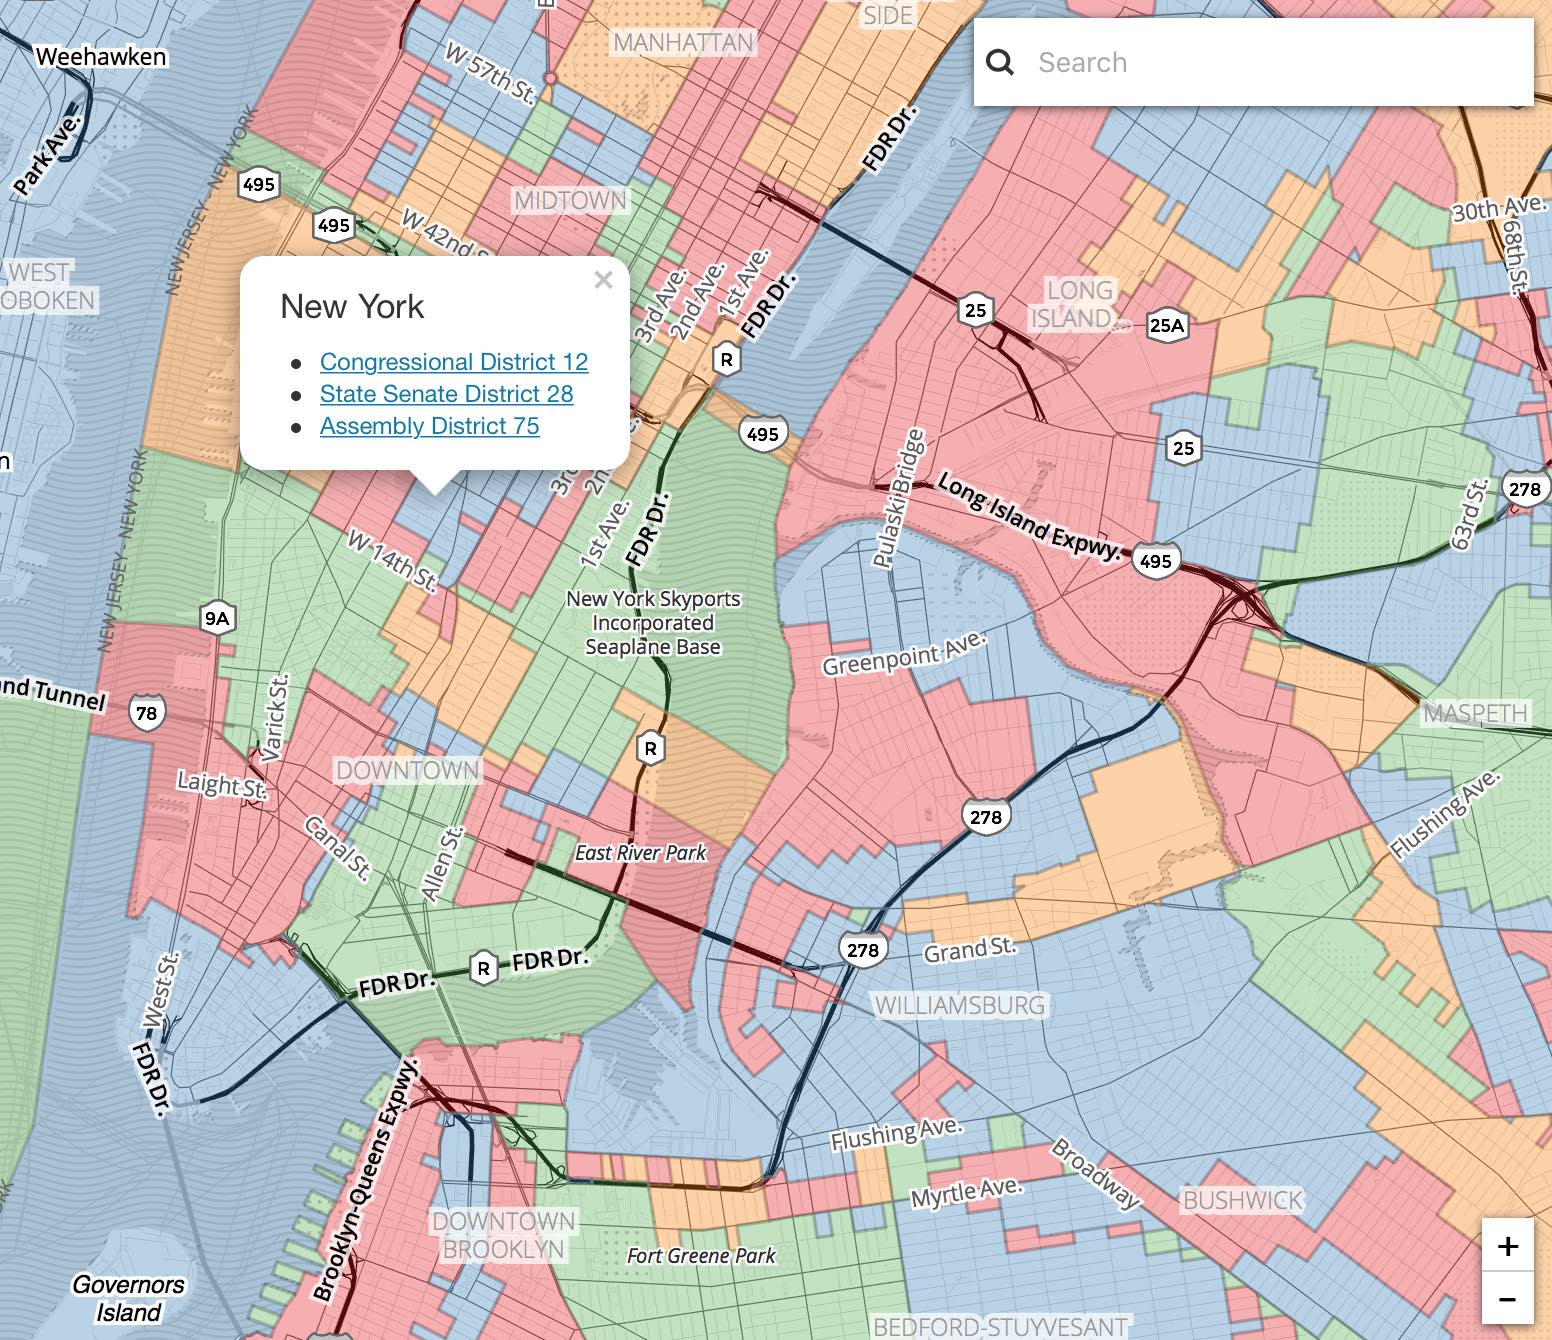
One thing that’s clear from Mike’s posts is that the spatial data required to do this kind of work is hard to come by. These are essentially shapes on the map that represent something called an “election district”. Confusingly this is NOT the same thing as a state legislative district (who you vote for in state senate and assembly elections), or a federal legislative district (who you can vote for in federal elections for the house of representatives), though it can determine who represents you from all three of these. The result is a “confusing patchwork quilt created by your state’s redistricting commission”.
Nathaniel Kelso and Mike Migurski’s election-geodata project on GitHub aims to be a repository for exactly this this kind of spatial data that’s relevant to evaluating gerrymandering — “precinct shapes (and vote results) for US elections past, present, and future”. The data comes from a patchwork of sources, and there is this handy cell-phone-network style “coverage” map of places that do or don’t have election district data:
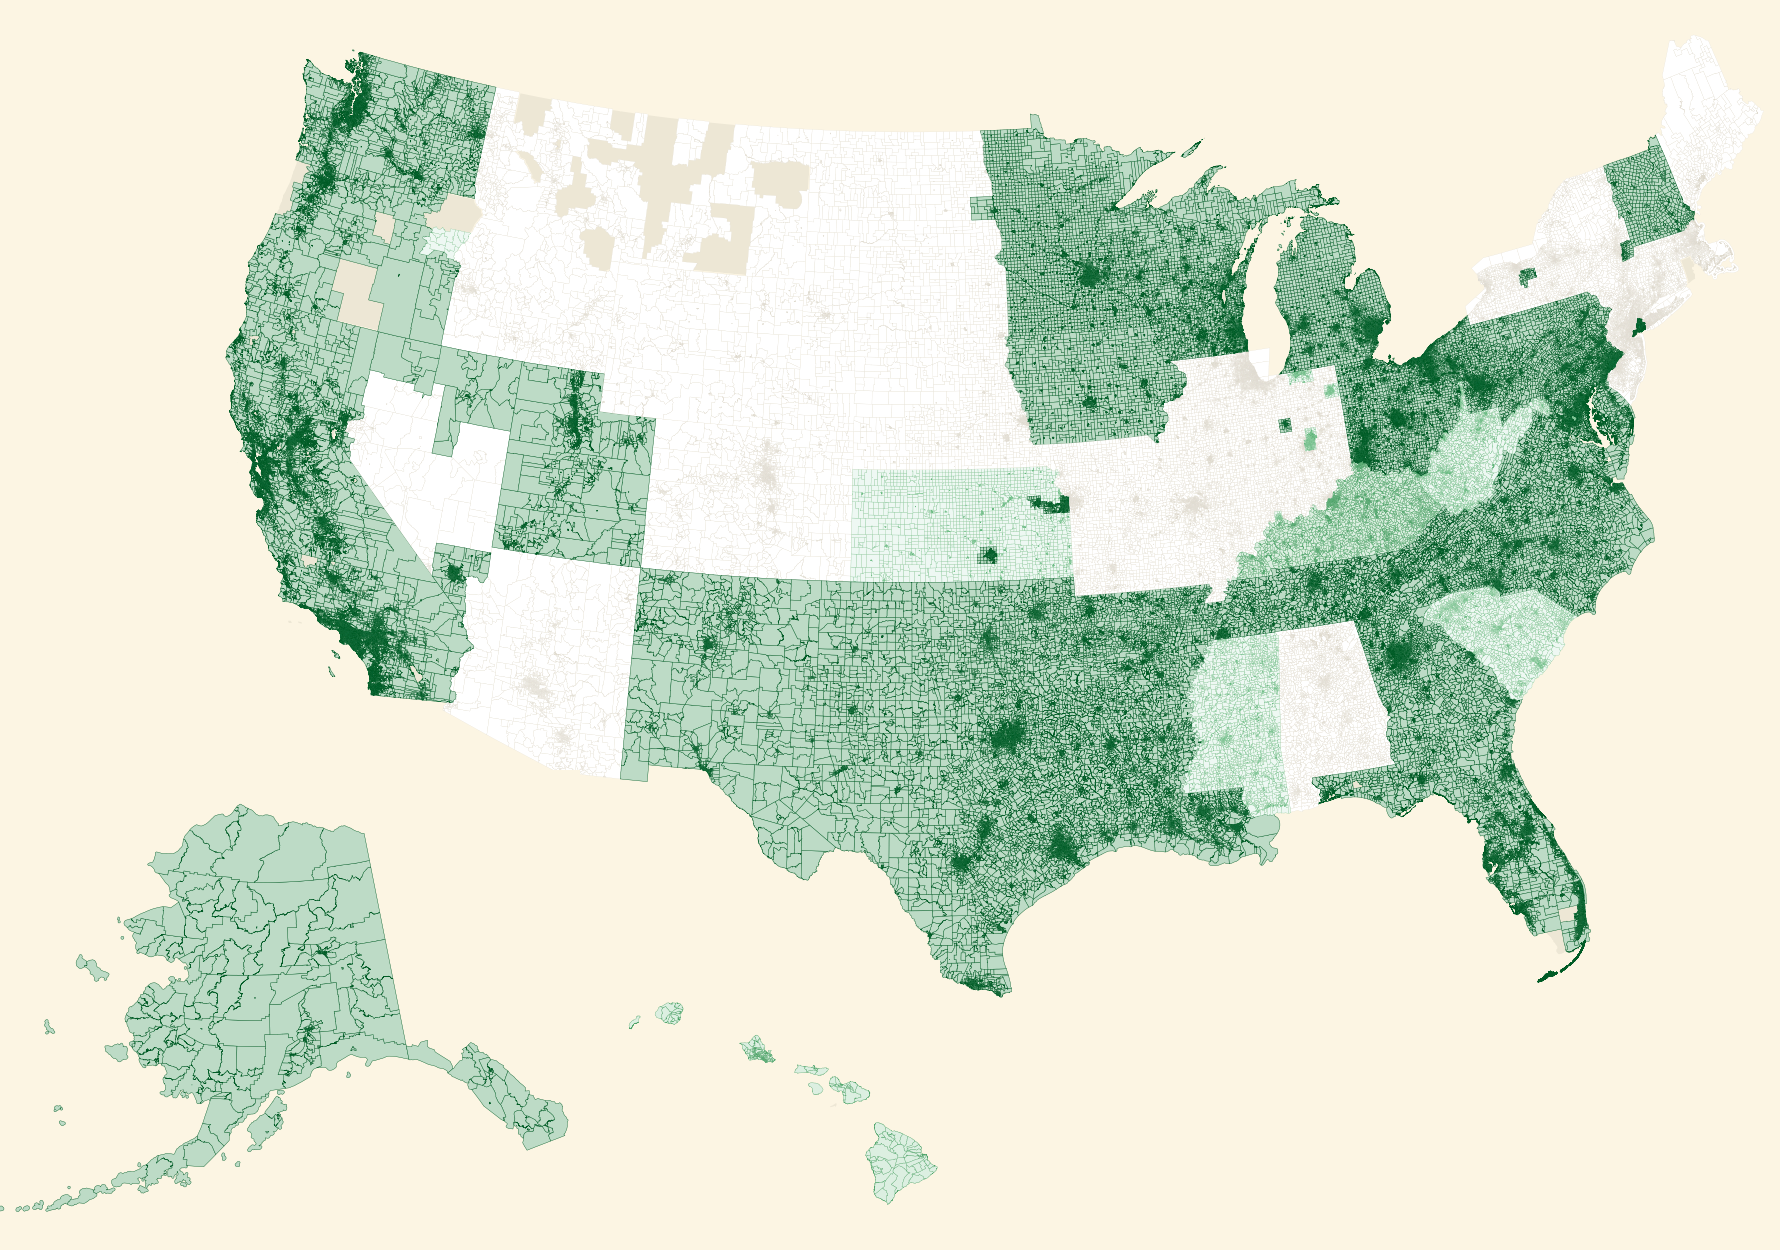
Dark green = newer 2016-2017 precincts, Medium green = 2014-2015 precincts, Light green = 2011-2012-2013 precincts, Light brown = older 2010 precincts, Medium brown = missing precincts
I was immediately struck that the coverage my own fair state of New York looked abysmal! Here’s a zoom:
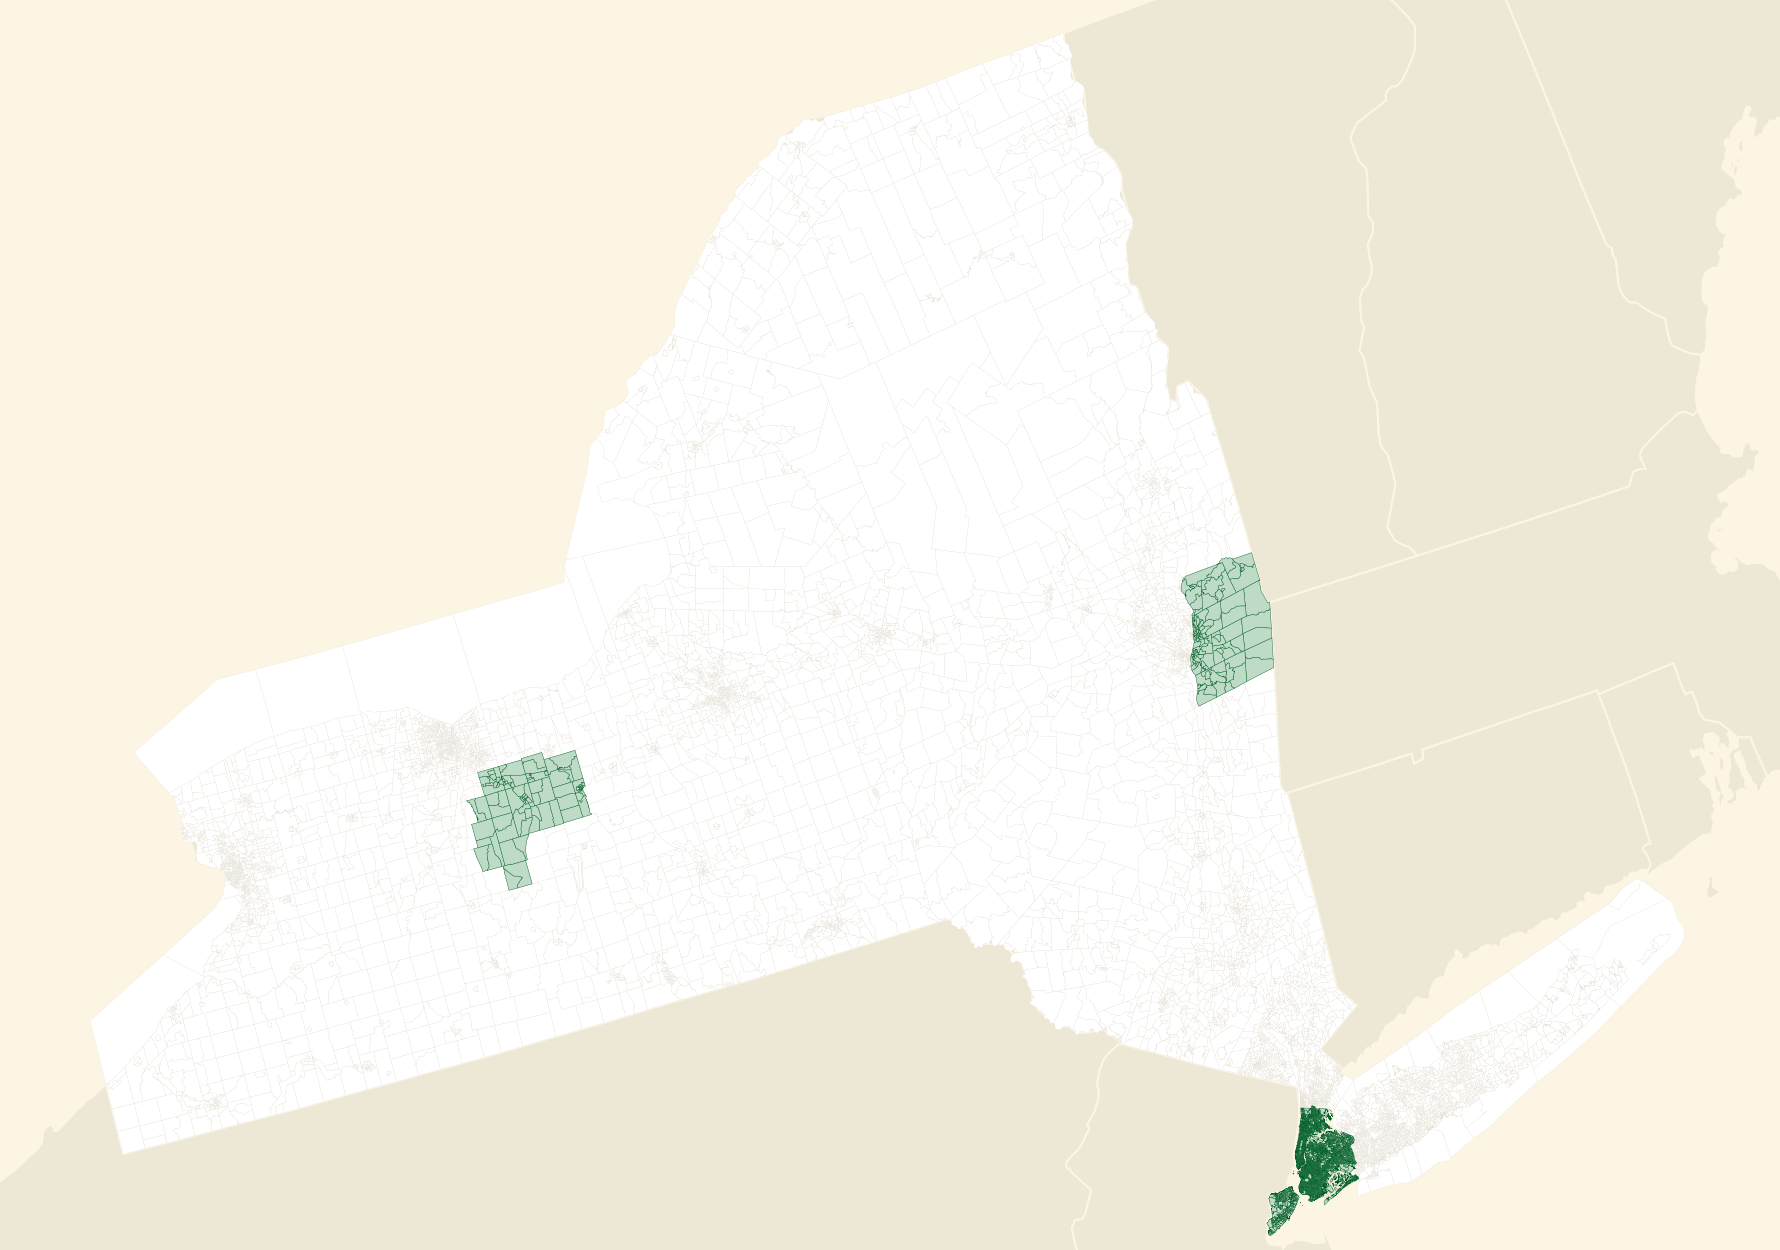
That’s basically the New York City counties (Kings, Queens, New York, Bronx, Richmond), Ontario, and Rensselaer counties, + the 2010 census data (shown in white). I was curious whether this map could possibly be true — is NY state election data really this spotty? — and ran into the reality that each county in New York (there are 62) is responsible for maintaining its own district shapes! Some counties like NYC have great publicly available data, but most have none at all.
Digging in further, I arrived at an interesting website for a government entity called LATFOR, which somehow stands for “NYS Legislative Task Force on Demographic Research and Reapportionment”. This appeared to be a good potential source for election data!
In 2017 I emailed them, describing my quest for election district shape data for use in a public-spirited data project, and how to get in touch. I got a cryptic email follow-up, with a phone number from a demographer who works for the commitee. Getting on the phone with this person had the quality of Kafka’s “The Castle”: every round of correspondence required several back-and-forths of leaving and responding to voicemails, and our conversations felt observed, operating under unseen rules or procedures that prevented this person from communicating clearly about what election data the LATFOR had and whether or not I could have it. It really felt like this:
“There is no telephone connection to the castle, there’s no switchboard passing on our calls; if we call someone in the castle from here, the telephones ring in all the lower departments, or perhaps they would if, as I know for a fact, the sound was not turned off on nearly all of them.
Now and then a tired official feels the need to amuse himself a little—especially in the evening or at night—and switches the sound back on, and then we get an answer, but an answer that is only a joke. It’s very understandable. Who has the right to disturb such important work, always going full steam ahead, with his own little private worries?”
Helpfully though, in the end the person I spoke to said that there might be more “formal” ways of requesting the data, at which point we concluded our correspondence. Reading between the lines, I assumed he meant that I should send him a Freedom of Information Law request, which allows certain information in the public trust to be made accessible if you know what to look for, and are willing to send formal letters to the appropriate government entities.
Typically for myself, I proceeded to let this project lapse for an entire year, until I was inspired by an unrelated project to request on Muckrock the source code for the Seattle public transit “fare enforcement” software (which lead to the requester being sued (!) by a software company). I had never heard of Muckrock before, which (in brief) automates all of the letter-writing and correspondence of making freedom of information requests for you! For the genuinely low cost of $5. It’s perfect for people like me who find it unreasonably difficult to do any errand involving the post office.
After a few rounds of back and forth with LATFOR, facilitated by the staff of Muckrock, I got the goods! Here is the related FOIL thread, publicly-available on Muckrock. The result is a ZIP file including “any geographic shapefile data for election districts within New York state, from the even election years of the past decade: 2008, 2010, 2012, 2014, 2016 and 2018”.
What followed was essentially a data entry task. The files were organized by county, but predictably, every county did things differently. File and column names were all over the place (“Electin Districts”, “nyed.shp”, “YATEVOTE.SHP”). Once the files were in place, there was still some some work to be done assessing what the spatial reference system of each of the map files was, with intermediate results looking like the counties of NY had experienced tectonic drift:
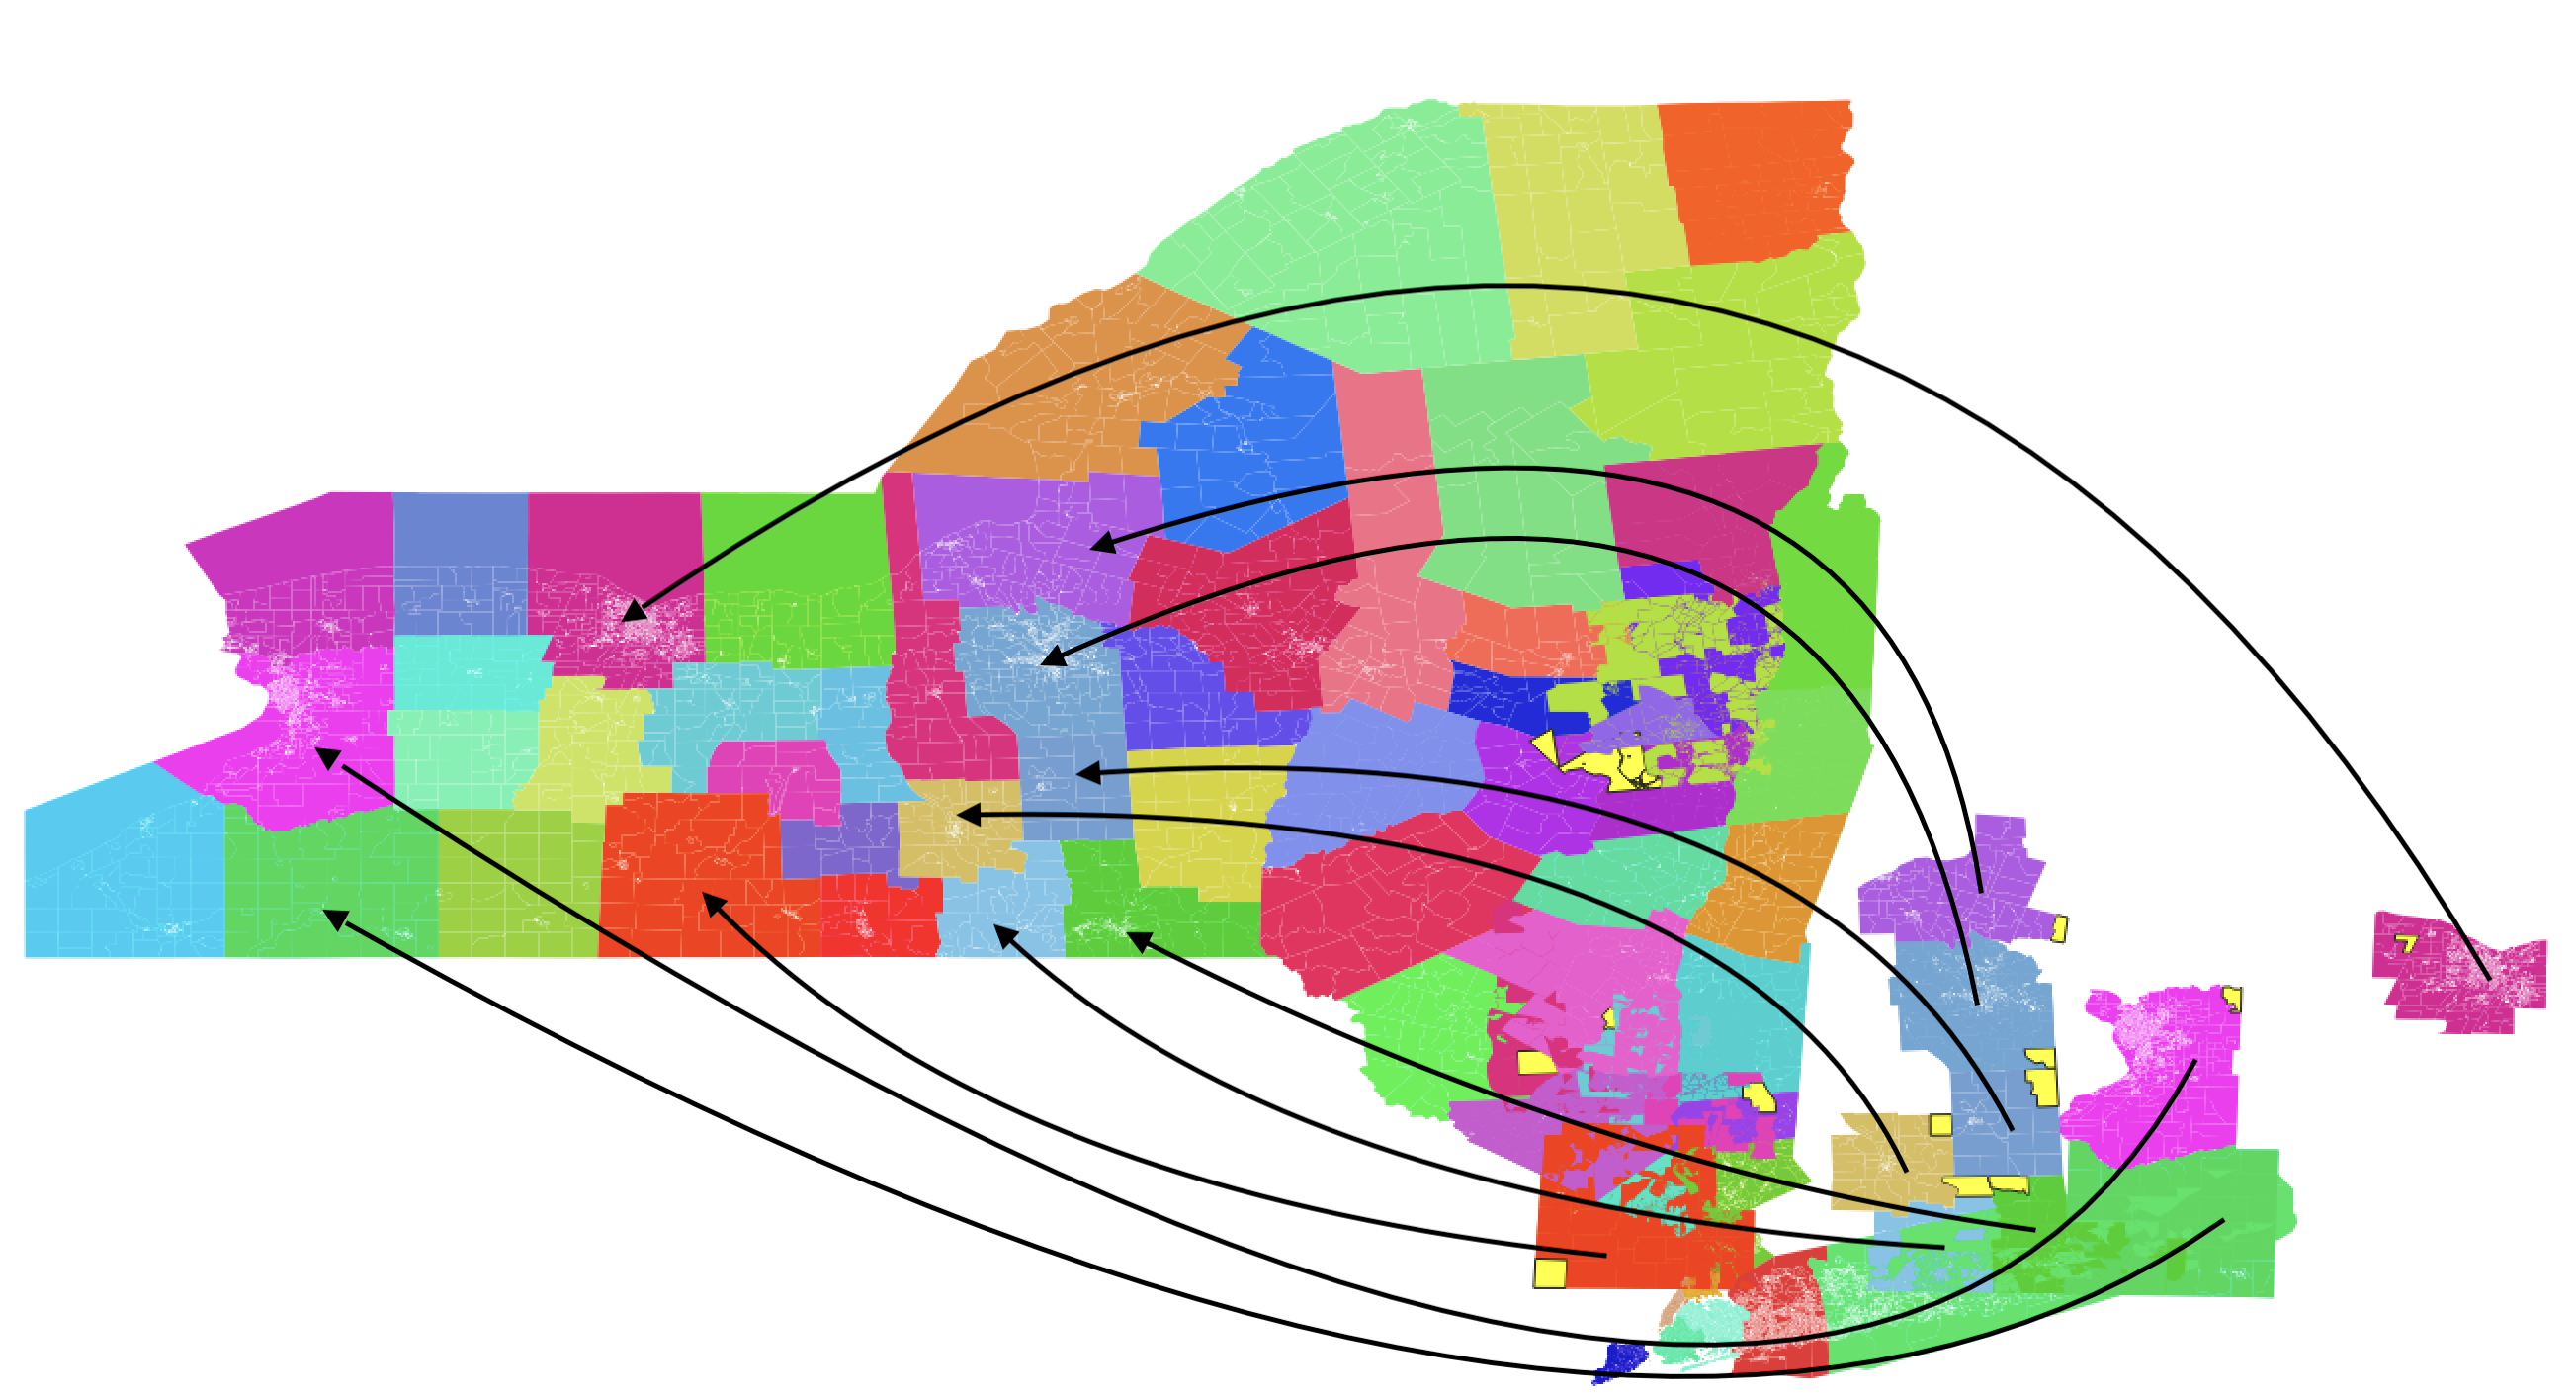
After some help geographically wrangling the data from Nathaniel Kelso and Mike Migurski, the data was added, with the final New York state result looking like this:
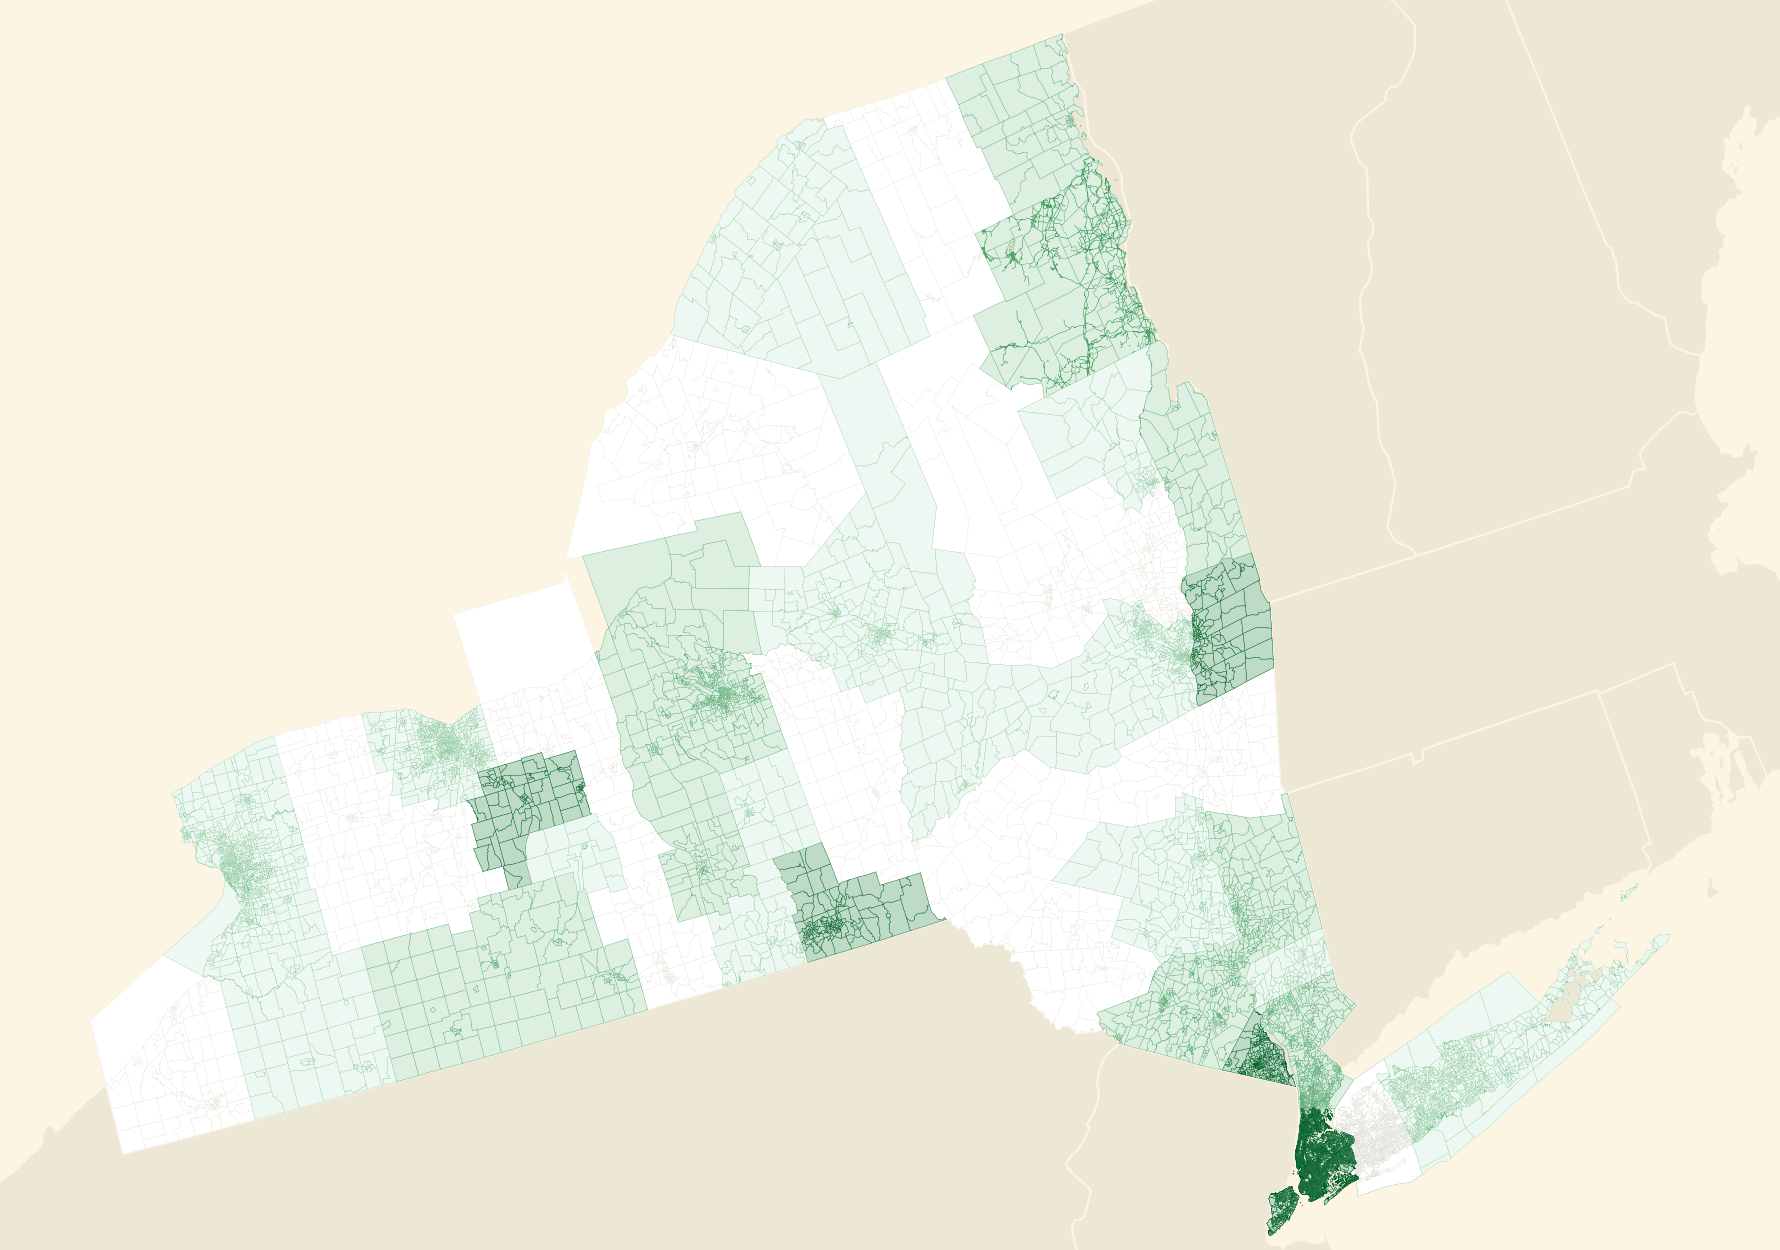
Many more counties now have some more recent election coverage, though not all; the data dump only included shapefile data for 38 of New York’s 62 counties 3. The remaining white shapes on the map are counties that either had data from before 2010 (which is when all counties have some Census-provided data), or have no data at all beyond the Census-provided data.
This contribution to the election-geodata project is obvoiusly one of many, and hopefully will assist the work that organizations like PlanScore, which evaluates partisan outcomes of electoral redistricting shapes, are able to do in New York state.
1. “baby steps towards measuring the efficiency gap”
2. “things I’ve recently learned about legislative redistricting”
3. albany, allegany, broome, cattaraugus, cayuga, chemung, clinton, cortland, dutchess, erie, essex, herkimer, monroe, nassau, new-york, niagara, oneida, onondaga, ontario, orange, orleans, oswego, otsego, putnam, rensselaer, rockland, st-lawrence, schenectady, schoharie, steuben, suffolk, tioga, tompkins, ulster, warren, washington, westchester, yates