THE REGEX KING
Jeff Sisson's blog (email me)
Entry-level reggae
Feeling good I got this silly beer at a large tent blasting entry-level reggae.
This term, “entry-level reggae”, from Jacob’s scene report at the Minnesota State Fair, perfectly captures a solution to a personal mp3/id3 genre madness that’s afflicted me for years…I love Augustus Pablo, Sugar Minott, Cornell Campbell, Scientist, Roots Radics, King Jammy, Junjo Lawes, Yellowman, etc, but I kinda can’t stand Bob Marley. For a long time I would call the Jamaican music I listen to any name but reggae: “Dub”, “Dancehall”, even “Roots Reggae”…really anything that didn’t signify Bob Marley. No disrespect to Bob! But now I have entry-level reggae, which captures this distinction within the beautiful and wide world of Jamaican music. Entry-level reggae is the stuff I hear playing at my son’s vaguely-caribbean themed swim school waiting room. It’s probably the only Jamaican music some people will ever encounter…and that’s OK, because entry-level reggae as a taxonomical distinction allows me to live in peace with reggae itself as a genre again!!
Nick Straker Interview
I love this interview with Nick Straker, on this lovely non-database/non-https Discog website. Disco and boogie heads will know Nick Straker from the titular Nick Straker Band, whose killer single is “A Little Bit of Jazz”. If you’ve never heard it, stop here and put it on:
I love the way he describes the casual circumstances of recording that song in particular. I’d always assumed the title was something of a joke — I’m pretty sure I picked up the vinyl copy I have because it was misfiled in a jazz bin at a record shop — but no it was actually “a kind of experiment to fuse Eurodisco with Herbie Hancock style Jazzfunk”! I can now hear this, and it makes me love this song even more.
He also describes this bit about how both before and after his brief fame, he played in dub bands, and maybe preferred the backing role:
We recorded one more album, but it was all over really. I’d been working with the Dennis Bovell Dub Band and Linton Kwesi Johnson and preferred that to being a ‘star’. I’d also been writing with China Burton with whom I had another American dance hit “Do you want it right now” (recorded by Siedah Garrett and produced by Jellybean Benitez). The enthusiasm had gone. I’ve got some great memories of that time though, some that are almost physically painful with nostalgia, and many that just make me cringe! Could I do it again? Maybe if I had a personality transplant!!

Queens hydro power
Running a small weather station presents many opportunities to indulge in a particular fantasy of how software and data should work: for the small cost of a few sensors and a rented server, I can record weather data that has a very specific terroir…it comes from a specific and real place in Queens! I can store that data and do anything with it forever, without worrying about some provider or API going down or going out of business.
I’ve come to treat this vision of data provenance as a creative constraint: I generally only put weather data on Big Boy Weather where I know where it comes from, or had a hand in producing it. This constraint can indeed be quite limiting: many types of weather forecast depend on radars or high altitude balloon readings that I don’t have the means to produce myself, and so Big Boy Weather is unlikely to ever provide accurate 5-day weather forecasts or track hurricanes.
There’s been a recent development in Queens for which I’m making an exception to this general rule: the Champlain Hudson Power Express is a long range power line connecting Canadian hydro power from dams in Québec that was recently connected to the ConEd power substation on the north coast of Astoria, Queens (about 2 miles or so away from Big Boy Weather). It’s normally not possible to say for certain whether or not any given electron was produced by a particular energy source like the Champlain Hudson Power Express: energy producers send electricity into a large grid that moves electrons to wherever they can be consumed right now. So it’s typically tricky to answer questions about how much of NYC’s energy needs are provided by any given non-fossil-fuel energy source: even where we build wind/solar/hydro/nuclear/battery energy, the energy produced tends to be diffused into the energy grid in a way that makes it hard to track except where you’re looking across the entire energy grid of New York.
This new Queens hydro connection is different: the power station it connects to in Astoria is close to the geographic center of New York City, and so we can reasonably assume all of those hydro power electrons are being used within the city. This electron (& data) Queens-locality fits nicely with the broader ethos of Big Boy Weather: I want to know where the data is coming from geographically, and here I can! And so I wrote a script that scrapes total NYC energy consumption along-side Queens hydro energy generation from the NY state energy grid operator every 5 minutes. Those data are rendered as a tiny chart with the last two hour’s of energy use in brown and Queens hydro energy production in blue. Here’s the live graph:


As of writing, there’s actually no Queens hydro energy being produced, and so the chart is all brown: the power line has been turned on and off over the course of July/August 2026 due to ongoing technical issues. The line is meant to deliver a stable 1250 megawatts worth of hydro power, which on a low energy day would provide around 15% of NYC’s energy usage (pretty good!). Over the past weeks, I’ve instead observed 600mW, 100mW, and 0mW at different times of day; I assume they’re doing a lot of flipping on and off the big lightswitch at some point between Queens and Québec. As with other Big Boy Weather offerings, I’m recording this temporal data in the event that this fluctuation becomes interesting over time, and also to possibly try to correlate changes in temperature/humidity with NYC-wide energy usage generally.
“Mack the Knife” — Louis Armstrong (1956)
I was listening to an archival radio broadcast from the late Phil Schaap about the swing jazz band man Tiny Bradshaw. In full Phil Schaap discursive mode, he briefly detoured to describe a recording that Louis Armstrong has made of “Mack the Knife” with Lotte Lenya, the singer who’d made this song famous originally in the 1930’s as part of Threepenny Opera. Mack the Knife is a stone cold classic; I knew Louis Armstrong had recorded it, but hadn’t quite appreciated that it was his recording that put reinserted it onto the cultural agenda, and that he’d recorded a version with Lotte Lenya!
From this essay on the occasion of the Lotte x Louis recording being added the Library of Congress:
[Mack the Knife] had the makings of a hit single, but [producer George Avakian] was unable to persuade any of Columbia’s artists to play his hunch. Dave Brubeck, Erroll Garner, and Gerry Mulligan all turned him down flat, finding the simple tune of “Moritat” to be too repetitious.
…not too repetitious for Louis, though! His immediate reaction is “LFG”:
“Oh, I’m going to love doing this!” he told Avakian. “I knew cats like this in New Orleans. Every one of them, they’d stick a knife into you without blinking an eye! ‘Mack the Knife’! Let’s go!”
The recording he made with Lotte Lenya wasn’t itself released immediately, and Phil Schaap noted that she doesn’t quite know how to swing her lines. This version is as cute as you think it might be:
talk2html
I like a live event where the format is people riffing, and try to attend these when I can. It’s also remarkable that we live in an era with unprecedented access to recordings of these types of live events: I’m always seeing or being sent links to a video recording of a presentation, a panel discussion, or a video version of a podcast.
Unfortunately, the practice of watching or listening to recordings of a talking event has never worked for me: I don’t have a car commute, I don’t use headphones on the train or the bike, and I’m not able to listen to recordings of people talking while I’m on the clock at work. When I do have time at home available for durational media, I’m trying to listen to music, catch a basketball game, watch a movie, or watch braindead TV, in that order.
I do, however, have plenty of other time to read, and this has become even more true as my kid has learned to read and we’ve unlocked “everyone in the family is reading at the same time”. I’d always wondered whether I might be able to catch more of these live event recordings if I could timeshift them from durational media to written media.
To gather some data on this hypothesis, I made a command line tool called talk2html. This tool wraps the excellent yt-dlp command line tool to download videos from YouTube, and post-process them as a filmstrip of images from the video with text presented along-side the recording’s images.
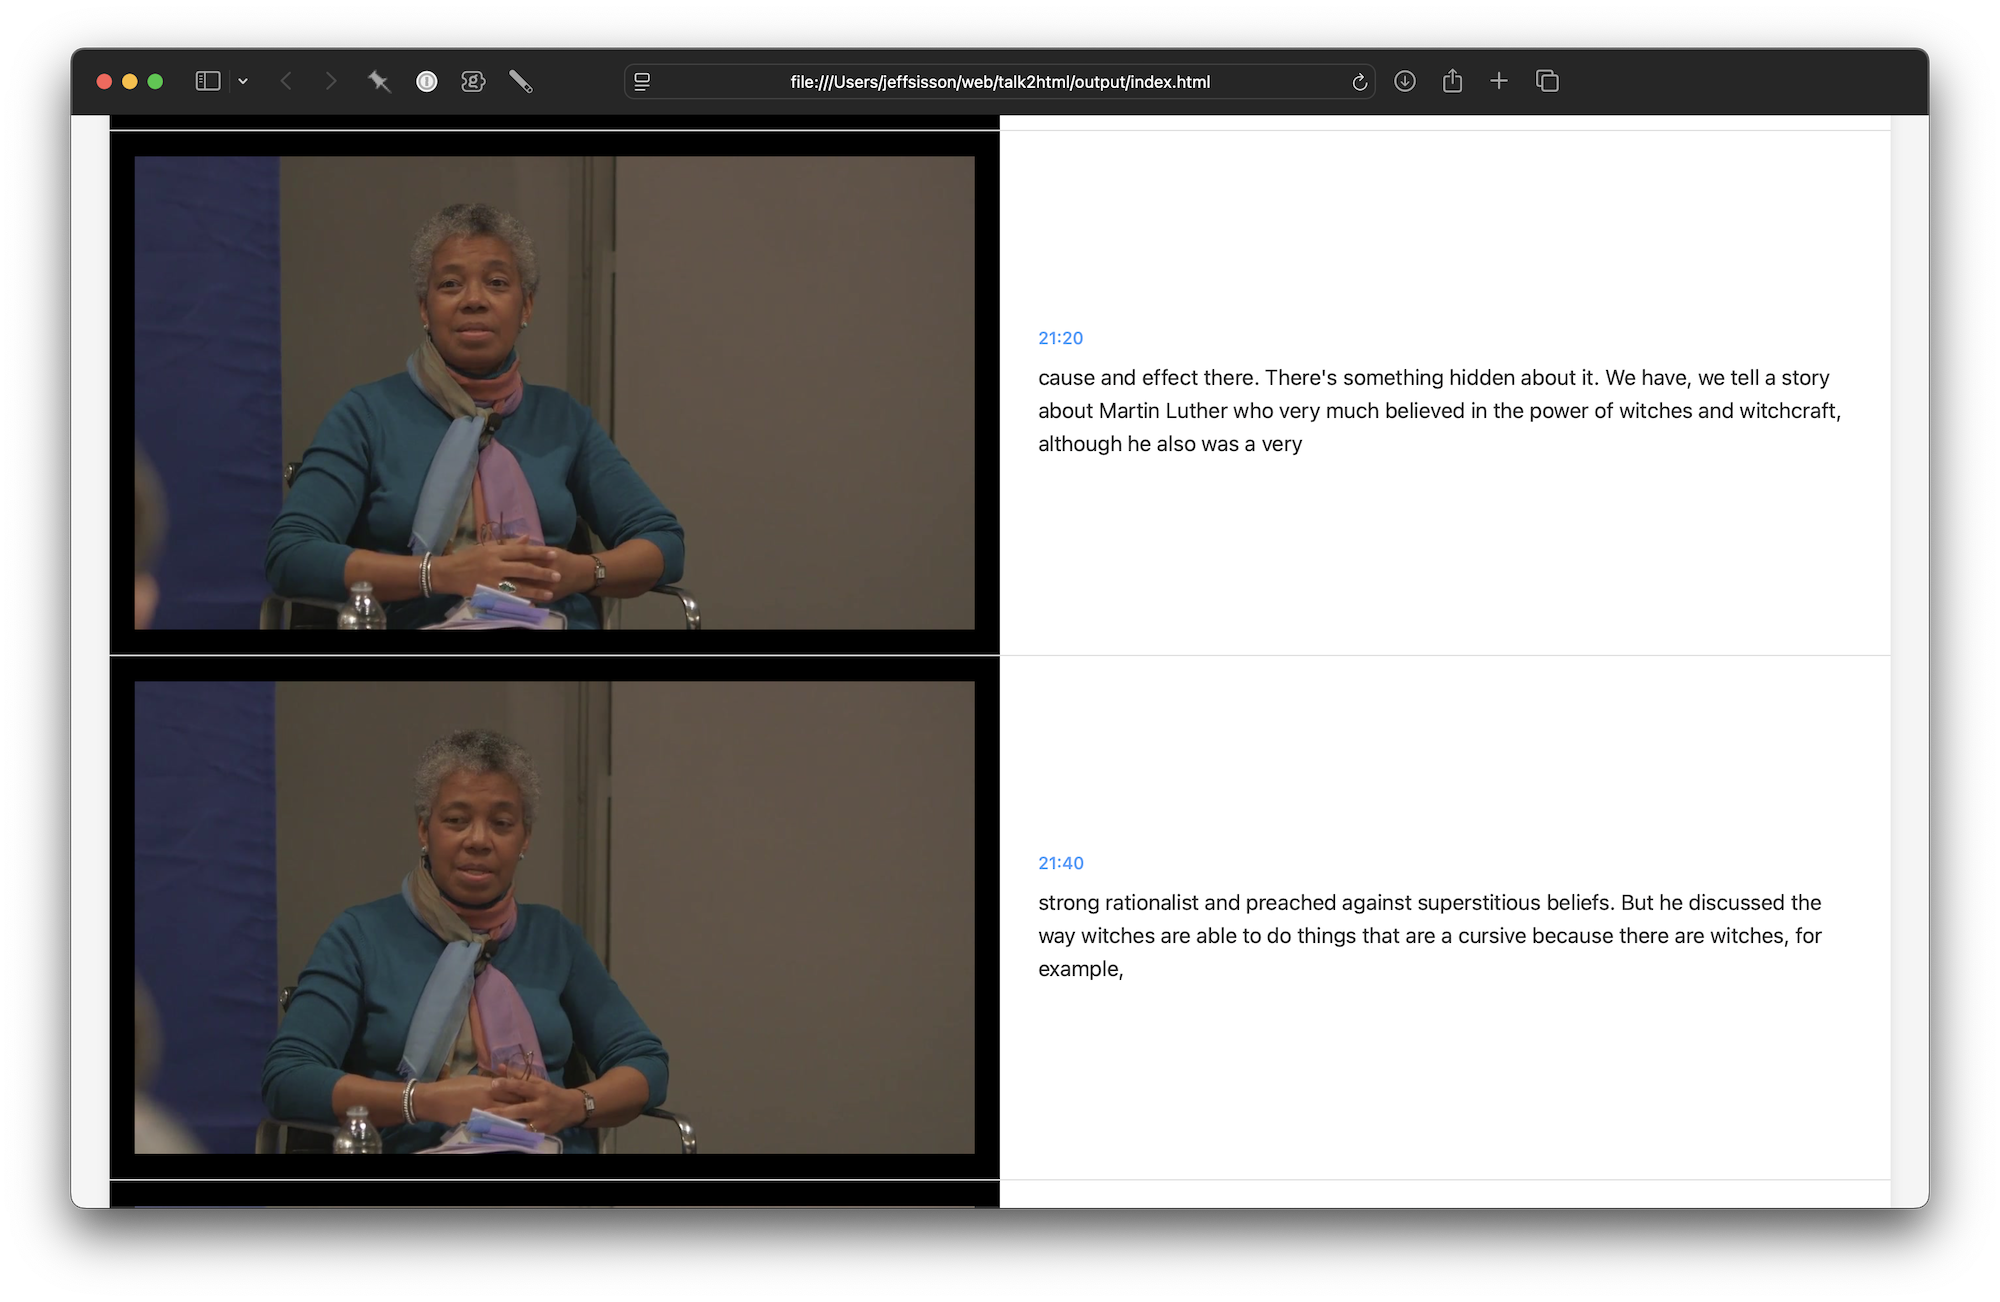
talk2html.I’m not yet sure if “reading” a talk/panel/discussion/podcast instead of watching it loses something in translation. I just tried “reading” this great conversation between Barbara Fields and Ta-Nehisi Coates; it was cool to be able to read the whole thing where I almost certainly would not have otherwise had time to watch it at all. I suspect this tool will help me to move recordings like these off of my “to watch” list.
But I still found myself jumping to specific parts of the recording where the automatic transcript wasn’t good, or where it was clear that some meaning was being lost as written vs. as spoken. Which is maybe just to say: I do not recommend talk2html for use by grindset guys who are looking to try to pound media (written or durational) like nutraceuticals in a functional smoothie.
On the other hand, I did use talk2html to “read” a conference talk about local-first software, which I won’t name. That talk turned out to be kind of low information and vaporware to my taste, and I was glad to not have spent an hour with it.